Zoom Video Communications

Overview
Zoom Video Communications is a fast-growing SaaS company in the video communication industry with a very high gross margin and a healthy balance sheet. It also invests heavily into future growth. With a lot of cash on hand generated through business operations and from recent IPO, Zoom stays nimble in the fast changing technology landscape.
Background
Zoom was founded in 2011 by Eric Yuan, a former Cisco engineer who got upset with the product he worked on -- a video conferencing app called WebEx. [1] Finding WebEx very difficult to use, Eric asked his boss to let him rebuild WebEx, but his boss wasn’t very convinced. Instead, Eric left Cisco and started his own startup. When building Zoom, Eric always had the ease of use for the customers and reliability in his head. Through meticulous execution and frugality, Zoom thrived and excelled in a crowded market where multiple tech giants have their own product competing with Zoom, and went public in 2019 [2] with a valuation of $9.2 billion.
Eric Yuan joined WebEx, a web conferencing startup, in 1997 [1]. WebEx was later acquired by Cisco in 2007, and Eric became Vice President at Cisco [3]. As the founder of Zoom, Eric has worked in the web conferencing industry for 23 years, while the company he founded, Zoom, has been in the industry for 9 years.
Revenue and source of growth
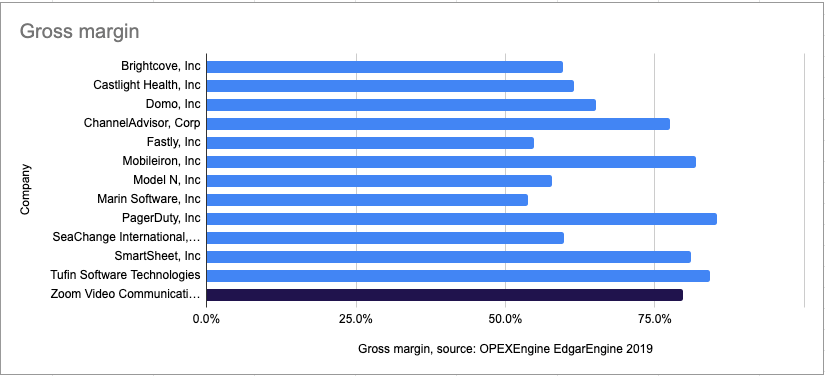
Zoom’s revenue entirely comes from subscriptions of paying users to its platform[4]. For the one year period as of Jan 31st 2020, Zoom generated $622 millions of revenue. With a gross margin of 81.47% for the same period and 79.7% for the year until Jan 31st 2018, Zoom sits comfortably at the top of the range for the gross margins of SaaS companies [5].
Zoom is a growth company. In the year ending in Jan 2020, Zoom spends 54.71% of its revenue in sales and marketing to drive old customer retention and new customer acquisition [4].
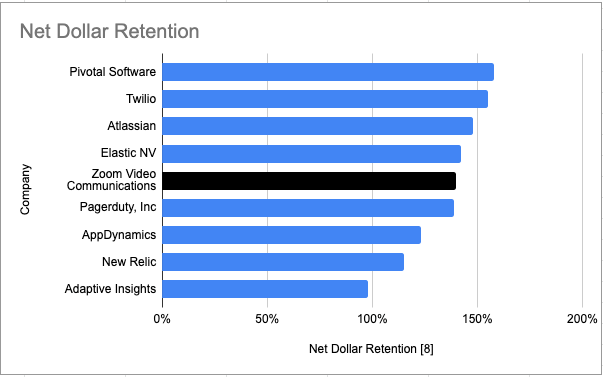
Zoom’s existing customers are paying more each year. Zoom has a net dollar retention (NDR) rate of 140%, net of customer churn [8]. Customers who started paying Zoom last year are paying 40% more this year, most likely because Zoom is living its philosophy of focusing on making the existing customer happy [10] -- as a result, existing customers love the product and are purchasing more subscription licenses.
For new customers, we can evaluate the efficiency of Zoom’s marketing machine with the implied months-to-payback. Months-to-payback evaluates how many months it takes on average for the customer to generate revenue that covers the customer acquisition cost. It is calculated by implied net new annual recurring revenue times the gross margin and divided by the sales and marketing spend of the prior quarter. Zoom has a median months-to-payback of 9.1 months for the 7 quarters ending in Jan 2019 [6]. As a rule of thumb, a payback period of 12 month is a good goal because that way, “customers are paying for themselves and becoming profitable within a year" [7]. In this regard, Zoom’s marketing machine is highly efficient.
As for research and development (R&D), Zoom only spends 10.77% of its 2020 revenue. At the first sight, it may look like Zoom was not investing enough into its technology, and it makes people wonder with this meager investment in R&D, how can Zoom maintain its moat? The secret is the “labor market arbitrage” [9]. Zoom’s product development team is largely based in China, where engineer compensations are less than that in the United States [9]. In China, an entry level engineer is paid about $34,350 a year on average, while a San Jose based counterpart costs $110,000 [9]. By utilizing the cheap engineering talent pool in China, Zoom is able to achieve both low cost and high quality at the same time for its R&D efforts.
With the aforementioned aspects of marketing and R&D, Zoom is able to achieve a 88.39% YoY revenue growth and 2.04% operating profit margin at the same time, which is not very common among SaaS companies which typically burns a lot of money to achieve fast growth.
Financial strength
Zoom’s financial strength can be measured from the following three aspects.
Liquidity
Liquidity is the amount of cash and cash equivalent that the company owns to manage its short term obligations [13]. One important measure, quick ratio, can be calculated by (current assets - prepaid expenses) / current liabilities [14]. By Jan 2020, Zoom had a quick ratio of 3.06, well above the safety line of 1 [13].
Solvency
Zoom is financed almost exclusively through equities (Except the convertible preferred stocks issued pre-IPO) and it doesn’t have any debt on its balance sheet [4]. By financing with equity, Zoom has no loan to repay and can channel more money into growing its business [12]. Solvency measures whether a company can meet debt obligations. With no debt on its balance sheet, there is no solvency issues with Zoom.
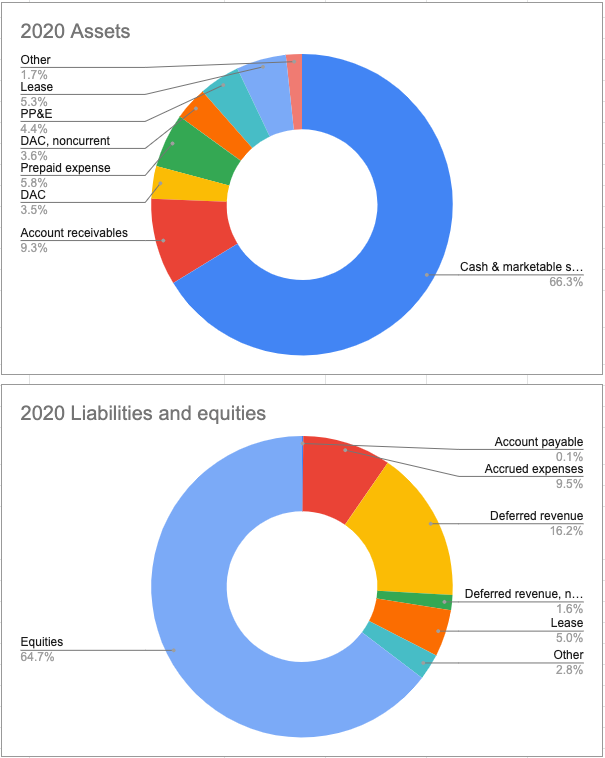
Source: SEC 10-K filing [4]
Zoom has a lot of cash on hand. By Jan 2020, Zoom has $855 million cash and marketable securities [4]. This enables Zoom to stay nimble in the fast-changing technology industry and seize the opportunity when it presents itself. The cash is coming from operating activities and financing activities. Operating activities contributed $151 million and financing activities (mostly the fund raised in IPO) contributed $615 million. From the operating cash flow we can see that the business is very healthy, in that it generates positive cash flow from operations and thus it can self-sustain.
Digging deeper into the balance sheet, we find that Zoom has a very small percentage of assets tied down in less liquid assets. By Jan 2020, only 4.4% of total assets are in properties and equipment and only 5.3% of total assets are in lease. With no debt or loan, Zoom has good liquidity overall.
Profitability and operating efficiency
Operating efficiency can be measured by operating margin. As evaluated in the previous section, an operating margin of 2.04% by Jan 2020 is relatively high among Saas companies. This proved that the company management is very efficient in keeping the cost low while achieving high growth and driving the company top line.
Investment attractiveness
In the most recent quarterly filings, Zoom has sixth-month net income of $213 million. The total stockholder’s equity is $1,198 million. Annualized return on equity (ROE) is 38.7%. Regarding ROE, Zoom is very efficient and profitable, especially when many Saas companies have negative net income.
During the Q2 2020 conference call, Zoom gave full year guidance on earnings per share (EPS) of $1.21 to $1.29 [15]. With the stock price of 520.52 on the closing of Oct 22 2020 [16], Zoom has a P/E ratio of 403 - 429. On average, Nasdaq stocks have a P/E ratio of 27.22 by Oct 22 2020 [17]. Investors look into the future and pay a huge premium to Zoom’s fast growth. As a result, Zoom is very overvalued at the moment and may not be an ideal investment at current price.
Conclusion
Zoom has achieved high growth and profitability by its effective marketing machine and low R&D cost. By financing with equity alone, Zoom is financially robust. However, due to the high valuation, Zoom may not be an ideal investment at the moment.
Reference
[1] A. Konrad, “Zoom, Zoom, Zoom! The Exclusive Inside Story Of The New Billionaire Behind Tech's Hottest IPO,” Forbes, 07-May-2019. [Online]. Available: https://www.forbes.com/sites/alexkonrad/2019/04/19/zoom-zoom-zoom-the-exclusive-inside-story-of-the-new-billionaire-behind-techs-hottest-ipo/. [Accessed: 23-Oct-2020].
[2] L. Picker, “Videoconferencing company Zoom prices IPO at $36 per share, indicates 63% spike on first trade,” CNBC, 18-Apr-2019. [Online]. Available: https://www.cnbc.com/2019/04/17/zoom-prices-ipo-at-36-per-share-source.html. [Accessed: 23-Oct-2020].
[3] T. N. Rogers, “Meet Eric Yuan, the founder and CEO of Zoom, who has made over $12 billion since March and now ranks among the 400 richest people in America,” Business Insider, 09-Sep-2020. [Online]. Available: https://www.businessinsider.com/meet-zoom-billionaire-eric-yuan-career-net-worth-life. [Accessed: 23-Oct-2020].
[4] “SEC Filing - ZM form 10-K,” Zoom. [Online]. Available: https://investors.zoom.us/node/7376/html. [Accessed: 23-Oct-2020].
[5] L. Kelly, “More Focus on SaaS Gross Margins in 2020,” OPEXEngine, 24-Jun-2020. [Online]. Available: https://www.opexengine.com/more-focus-on-saas-gross-margins-in-2020/. [Accessed: 23-Oct-2020].
[6] A. Clayton, “Zoom IPO: S-1 Breakdown,” Medium, 25-Mar-2019. [Online]. Available: https://medium.com/@alexfclayton/zoom-ipo-s-1-breakdown-119249acadd3. [Accessed: 23-Oct-2020].
[7] C. O'Donnell, “It's Payback Time: A Crash Course in Our Favorite SaaS Metric,” HubSpot Careers, 07-May-2015. [Online]. Available: https://product.hubspot.com/blog/its-payback-time-a-crash-course-in-saas-metrics. [Accessed: 23-Oct-2020].
[8] T. Tunguz, “Benchmarking Zoom's S-1:How 7 Key Metrics Stack Up by @ttunguz,” Tomasz Tunguz, 24-Mar-2019. [Online]. Available: https://tomtunguz.com/benchmarking-zoom-s-s-1-how-7-key-metrics-stack-up/. [Accessed: 23-Oct-2020].
[9] E. Kim, “Zoom, one of the most anticipated tech IPOs of the year, has one key profit driver: engineers in China,” CNBC, 26-Mar-2019. [Online]. Available: https://www.cnbc.com/2019/03/26/zoom-key-profit-driver-ahead-of-ipo-engineers-in-china.html. [Accessed: 23-Oct-2020].
[10] T. SaaStr, “Eric Yuan, Founder & CEO, Zoom: Get to $100m ARR While Burning Almost Nothing: 6 Learnings in 6 Years (Video + Transcript),” SaaStr, 21-Jun-2018. [Online]. Available: https://www.saastr.com/eric-yuan-founder-ceo-zoom-get-100m-arr-burning-almost-nothing-6-learnings-6-years-video-transcript/. [Accessed: 23-Oct-2020].
[11] “SEC Filing,” Zoom. [Online]. Available: https://investors.zoom.us/node/8021/html. [Accessed: 23-Oct-2020].
[12] "Advantages vs. Disadvantages of Equity Financing | The Hartford", Thehartford.com, 2020. [Online]. Available: https://www.thehartford.com/business-insurance/strategy/business-financing/equity-financing. [Accessed: 23- Oct- 2020].
[13] J. B. Maverick, “What Is the Best Measure of a Company's Financial Health?,” 02-Oct-2020. [Online]. Available: https://www.investopedia.com/articles/investing/061916/what-best-measure-companys-financial-health.asp. [Accessed: 23-Oct-2020].
[14] W. Kenton, “Quick Ratio,” Investopedia, 12-Sep-2020. [Online]. Available: https://www.investopedia.com/terms/q/quickratio.asp. [Accessed: 23-Oct-2020].
[15] J. Novet, “Zoom shares soar after revenue more than quadruples from last year,” CNBC, 01-Sep-2020. [Online]. Available: https://www.cnbc.com/2020/08/31/zoom-zm-earnings-q2-2021.html. [Accessed: 23-Oct-2020].
[16] “Zoom Video Communications, Inc. (ZM) Stock Price, News, Quote & History,” Yahoo! Finance, 21-Oct-2020. [Online]. Available: https://finance.yahoo.com/quote/ZM?p=ZM. [Accessed: 23-Oct-2020].
[17] “Nasdaq PE Ratio 2006-2020: NDAQ.” [Online]. Available: https://www.macrotrends.net/stocks/charts/NDAQ/nasdaq/pe-ratio. [Accessed: 23-Oct-2020].